Real Estate
Lynx Housing Dashboards
Occupancy, revenue, arrears and ROI at a glance
lynx_housing_dashboards
· v19.0.1.2.0
· Standard
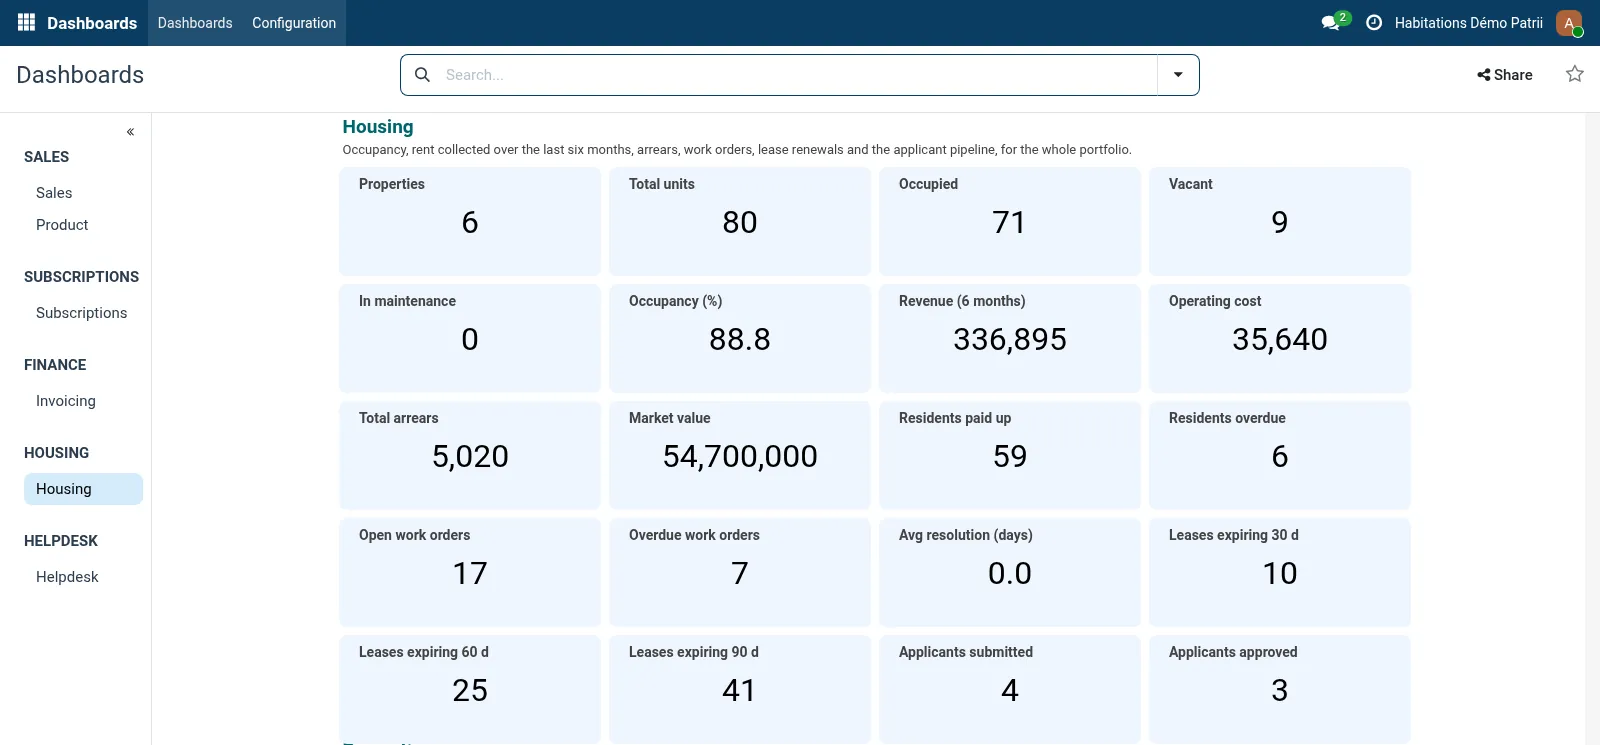
Housing Dashboards brings the numbers of a housing portfolio together: occupancy, revenue, arrears, expiring leases and open work orders, with ROI per property and monthly reports for owners.
Why teams pick it
What Lynx Housing Dashboards does for you
Portfolio KPIs
Occupancy rate, revenue, operating cost, arrears, lease expirations and applicants in one spreadsheet dashboard, next to every other dashboard in the Dashboards app.
ROI per property
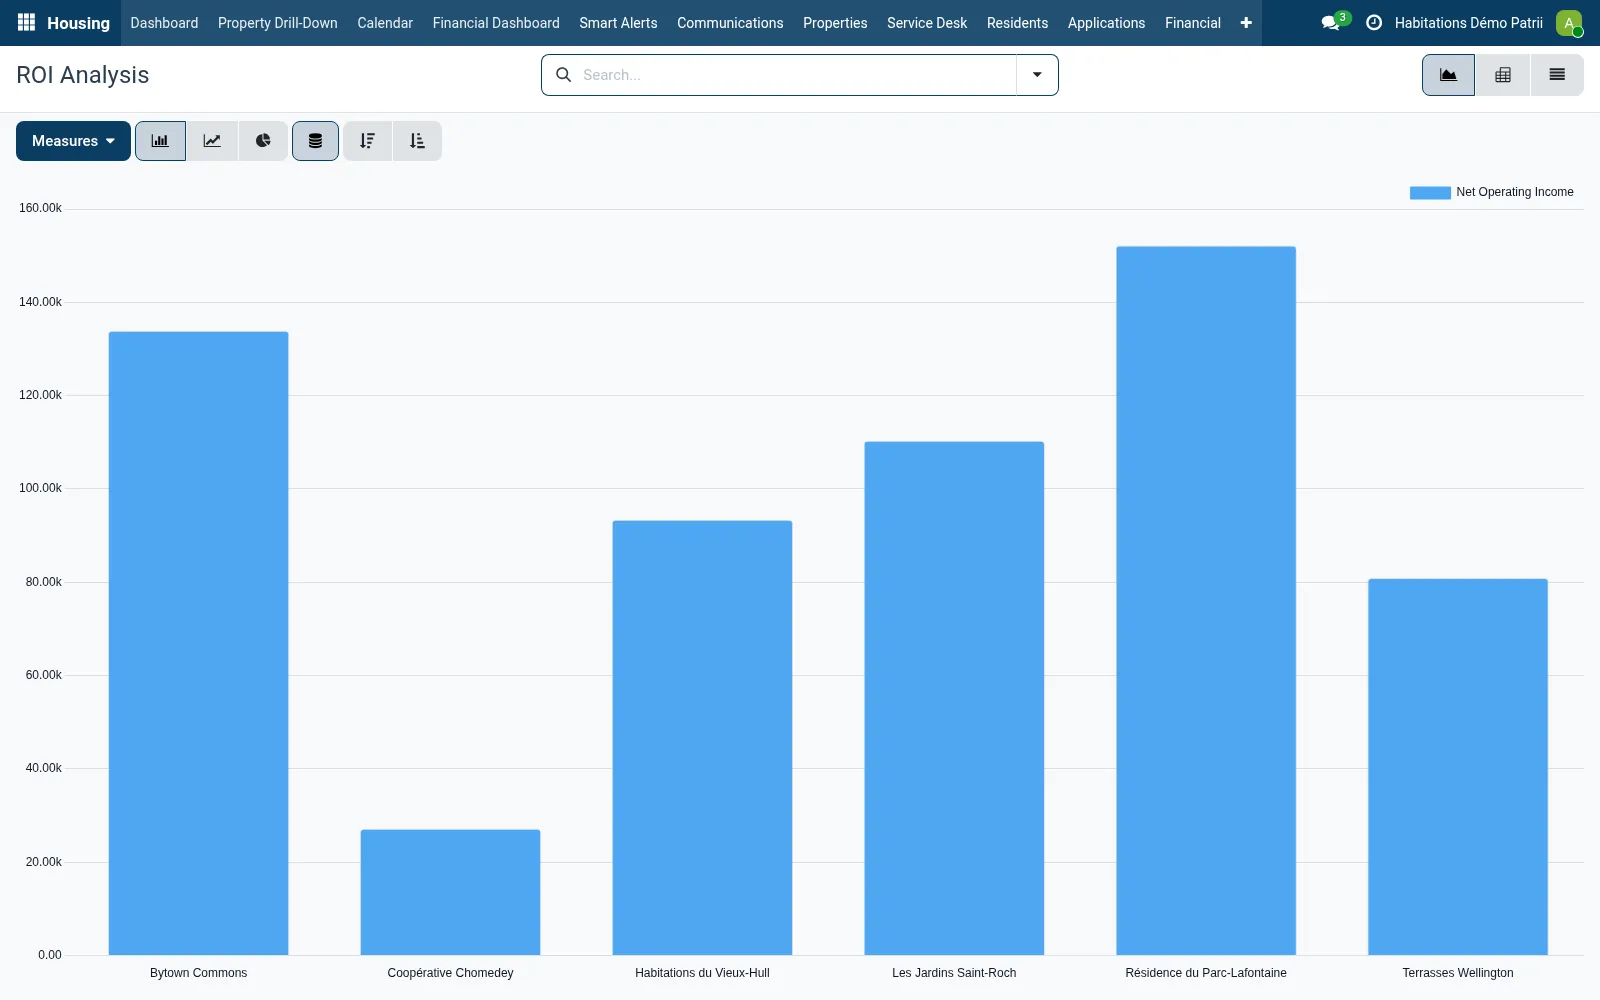
Net operating income, cap rate, expense ratio and the gap between current and market rent.
Monthly snapshots
Occupancy and revenue collected are recorded each month to follow trends.
Owner reports and portal
Monthly PDF reports to property owners, and a portal where owners see their properties and ROI.
Product tour
See it in action
Try Lynx Housing Dashboards on your team.
Free trial, no credit card. Talk to sales when you're ready.